How the GW myth is perpetuated
- Thread starter Walter
- Start date
You are using an out of date browser. It may not display this or other websites correctly.
You should upgrade or use an alternative browser.
You should upgrade or use an alternative browser.
A skeptical physicist ends up confirming climate data
Back in 2010, Richard Muller, a Berkeley physicist and self-proclaimed climate skeptic, decided to launch the Berkeley Earth Surface Temperature (BEST) project to review the temperature data that underpinned global-warming claims. Remember, this was not long after the Climategate affair had erupted, at a time when skeptics were griping that climatologists had based their claims on faulty temperature data.
Muller’s stated aims were simple. He and his team would scour and re-analyze the climate data, putting all their calculations and methods online. Skeptics cheered the effort. “I’m prepared to accept whatever result they produce, even if it proves my premise wrong,” wrote Anthony Watts, a blogger who has criticized the quality of the weather stations in the United Statse that provide temperature data. The Charles G. Koch Foundation even gave Muller’s project $150,000 — and the Koch brothers, recall, are hardly fans of mainstream climate science.
A skeptical physicist ends up confirming climate data - The Washington Post
WaPo was fooled or was in on this sleight of hand. Either way, very poor 'reporting'.
This is from 2008, there is no doubt that GW will happen, and there is not much that we can do about it without all countries cooperating.
"A temporary weakening of the ocean current which regulates global temperatures will see a slight cooling in Europe and North America, masking the effects of human-induced say German researchers.
A team from the Leibniz Institute of Marine Sciences, in Kiel, Germany, has said global warming may enter into a "lull" period until 2015. The naturally occurring slowdown is due to an expected cyclical change in the Gulf Stream, the water current which conveys warm surface water from the tropical Atlantic to the northern Atlantic and returns cold water southwards at a lower depth.
However the predict the Earth will once again enter into a warming phase after 2015 once the currents revert to a more warming trend."
http://www.thetechherald.com/article.php/200818/863/Weakening-in-Gulf-Stream-will-slow-global-warming-scientists
http://www.solcomhouse.com/gulfstream.htm
Last edited:
WaPo was fooled or was in on this sleight of hand. Either way, very poor 'reporting'.
In on what? The conclusion shouldn't shock anyone, the planet is warming...
PS. posted here earlier tonight:
forums.canadiancontent.net/climate-change/68017-our-cooling-world-26.html#post1494281
Scientist who said climate change sceptics had been proved wrong accused of hiding truth by colleague
Scientist Who Said Climate Sceptics Had Been Proved Wrong Accused Of Hiding Truth By Colleague
Best Confirms Global Temperature Standstill
Contrary to claims being made by the leader of the Best global temperature initiative their data confirms, and places on a firmer statistical basis, the global temperature standstill of the past ten years as seen by other groups.
Many people have now had some time to read the papers issued in preprint form from the Best project. My strong impression is that they are mostly poorly written, badly argued and at this stage unfit for submission to a major journal. Whilst I have made some comments about Best’s PR and data release strategy, I want to now look at some aspects of the data.
When asked by the BBC’s Today programme Professor Richard Muller, leader of the initiative, said that the global temperature standstill of the past decade was not present in their data.
“In our data, which is only on the land we see no evidence of it having slowed down. Now the evidence which shows that it has been stopped is a combination of land and ocean data. The oceans do not heat as much as the land because it absorbs more of the heat and when the data are combined with the land data then the other groups have shown that when it does seem to be leveling off. We have not seen that in the land data.”
My first though would be that it would be remarkable if it was. The global temperature standstill of the past decade is obvious in HadCrut3 data which is a combination of land and sea surface data. Best is only land data from nearly 40,000 weather stations. Professor Muller says they “really get a good coverage of the globe.” The land is expected to have a fast response to the warming of the lower atmosphere caused by greenhouse gas forcing, unlike the oceans with their high thermal capacity and their decadal timescales for heating and cooling, though not forgetting the ENSO and la Nina.
Fig 1 shows the past ten years plotted from the monthly data from Best’s archives. Click on the image to enlarge.

Best Confirms Global Temperature Standstill
It was hailed as the scientific study that ended the global warming debate once and for all – the research that, in the words of its director, ‘proved you should not be a sceptic, at least not any longer’. The Mail on Sunday can reveal that a leading member of Prof Muller’s team has accused him of trying to mislead the public by hiding the fact that BEST’s research shows global warming has stopped.
Professor Richard Muller, of Berkeley University in California, and his colleagues from the Berkeley Earth Surface Temperatures project team (BEST) claimed to have shown that the planet has warmed by almost a degree centigrade since 1950 and is warming continually.
Published last week ahead of a major United Nations climate summit in Durban, South Africa, next month, their work was cited around the world as irrefutable evidence that only the most stringent measures to reduce carbon dioxide emissions can save civilisation as we know it.
Scientist Who Said Climate Sceptics Had Been Proved Wrong Accused Of Hiding Truth By Colleague
Contrary to claims being made by the leader of the Best global temperature initiative their data confirms, and places on a firmer statistical basis, the global temperature standstill of the past ten years as seen by other groups.
Many people have now had some time to read the papers issued in preprint form from the Best project. My strong impression is that they are mostly poorly written, badly argued and at this stage unfit for submission to a major journal. Whilst I have made some comments about Best’s PR and data release strategy, I want to now look at some aspects of the data.
When asked by the BBC’s Today programme Professor Richard Muller, leader of the initiative, said that the global temperature standstill of the past decade was not present in their data.
“In our data, which is only on the land we see no evidence of it having slowed down. Now the evidence which shows that it has been stopped is a combination of land and ocean data. The oceans do not heat as much as the land because it absorbs more of the heat and when the data are combined with the land data then the other groups have shown that when it does seem to be leveling off. We have not seen that in the land data.”
My first though would be that it would be remarkable if it was. The global temperature standstill of the past decade is obvious in HadCrut3 data which is a combination of land and sea surface data. Best is only land data from nearly 40,000 weather stations. Professor Muller says they “really get a good coverage of the globe.” The land is expected to have a fast response to the warming of the lower atmosphere caused by greenhouse gas forcing, unlike the oceans with their high thermal capacity and their decadal timescales for heating and cooling, though not forgetting the ENSO and la Nina.
Fig 1 shows the past ten years plotted from the monthly data from Best’s archives. Click on the image to enlarge.

Best Confirms Global Temperature Standstill
No, seems like the Gulf Stream is holding its temprature longer every year.
Gulf Stream Sea Surface Temperatures Wednesday, October 26, 2011 12:04:00 PM GMT
Gulf Stream Sea Surface Temperatures Wednesday, October 26, 2011 12:04:00 PM GMT
I see drought in my future.
Ocean Temperatures in the 1930's Were Unstable
Scientists at NASA's Goddard Space Flight Center recently used a computer model and satellite data to examine climate over the past century. In the study, cooler than normal tropical Pacific Ocean temperatures and warmer than normal tropical Atlantic Ocean temperatures created ideal drought conditions due to the unstable sea surface temperatures. The result was dry air and high temperatures in the Midwest from about 1931 to 1939.
1934 United States Temperature Extreme Rankings by State
Judith Curry Opens Mouth, Inserts Foot
Posted on October 30, 2011 by tamino| 39 Comments
NOTE: See the UPDATE at the end of this post.
I didn’t expect Judith Curry to embarrass herself more than she did with her fawning over Murry Salby’s folly. But she’s topped (perhaps I should say “bottomed”) herself by a huge margin.
Anthony Watts was so excited he actually suspended his blog hiatus to report the story. He quotes the GWPF that “BEST Confirms Global Temperature Standstill,” and cites a story in the Daily Mail reporting that Judith Curry (a member of the Berkeley team) has roundly criticized Richard Muller (leader of the Berkeley team), on much the same basis. He quotes Curry herself, from the article:
As for the graph disseminated to the media, she said: ‘This is “hide the decline” stuff. Our data show the pause, just as the other sets of data do. Muller is hiding the decline.
With this statement, Curry reveals how little she understands the data created by the team of which she is a member, let alone the “other sets of data.” Which we might have anticipated, given that from what we’ve seen, she made little or no contribution to the actual Berkeley analysis.
Judging by her comments, it’s a good thing for the Berkeley team that she didn’t. The Daily Mail quotes her thus:
‘There is no scientific basis for saying that warming hasn’t stopped,’ she said. ‘To say that there is detracts from the credibility of the data, which is very unfortunate.’
That’s a pretty strong statement, Judith. Do you have a scientific basis to back it up? Have you actually analyzed the data from your own team? Do you even know?
Now that the Daily Mail and Anthony Watts have not only let the cat out of the bag but put it on display to make a “scandal” out of it, Curry seems to want to distance herself from her criticism. On her own blog she says:
I told Rose that I was puzzled my Muller’s statements, particularly about “end of skepticism” and also “We see no evidence of global warming slowing down.”
When asked specifically about the graph that apparently uses a 10 year running mean and ends in 2006, we discussed “hide the decline,” but I honestly can’t recall if Rose or I said it first. I agree that the way the data is presented in the graph “hides the decline.” There is NO comparison of this situation to Climategate. Muller et al. have been very transparent in their methods and in making their data publicly available, which is highly commendable.
My most important statement IMO is this: ‘To say that there is detracts from the credibility of the data, which is very unfortunate.’ My main point was that this is a very good data set, the best we currently have available for land surface temperatures. To me, this should have been the big story: a new comprehensive data set, put together by a team of physicists and statisticians with private funds. Showing preliminary results is of course fine, but overselling them at this point was a mistake IMO.
It seems to me that there are only two possibilities. Either Judith Curry hasn’t bothered to analyze the data from her own team — or she’s not competent to.
Just looking at the data isn’t enough. It’s all too easy to view some graph and get the wrong impression — in fact that what groups like GWPF exploit. Here, for instance, is the graph featured by GWPF:

The impression it gives, that global warming has stopped, is wrong. It’s the kind of easy misinterpretation based on the absence of both context and analysis which is constantly exploited by fake skeptics. I expect GWPF to disdain both context and analysis. But Judith Curry is supposed to be an actual scientist. I’m skeptical.
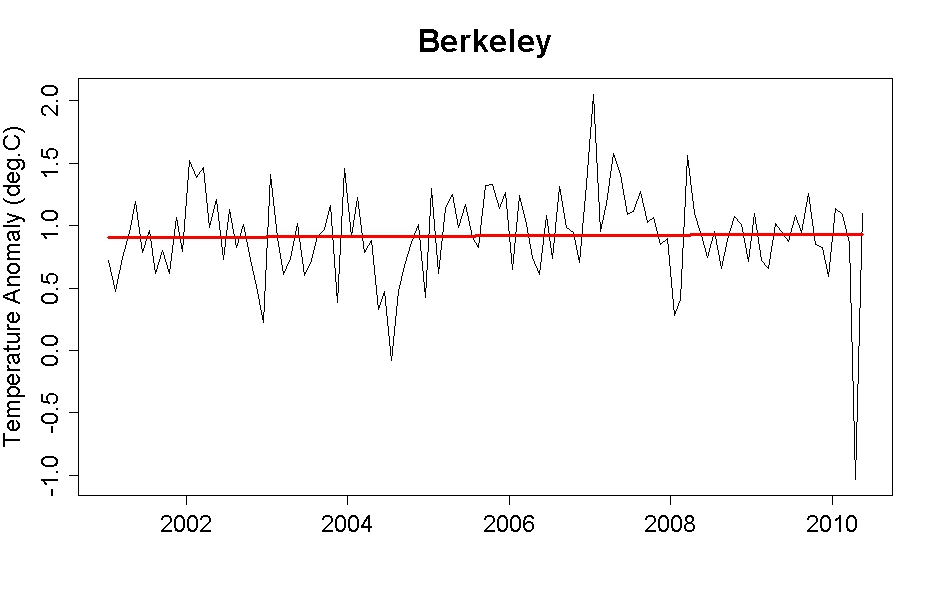
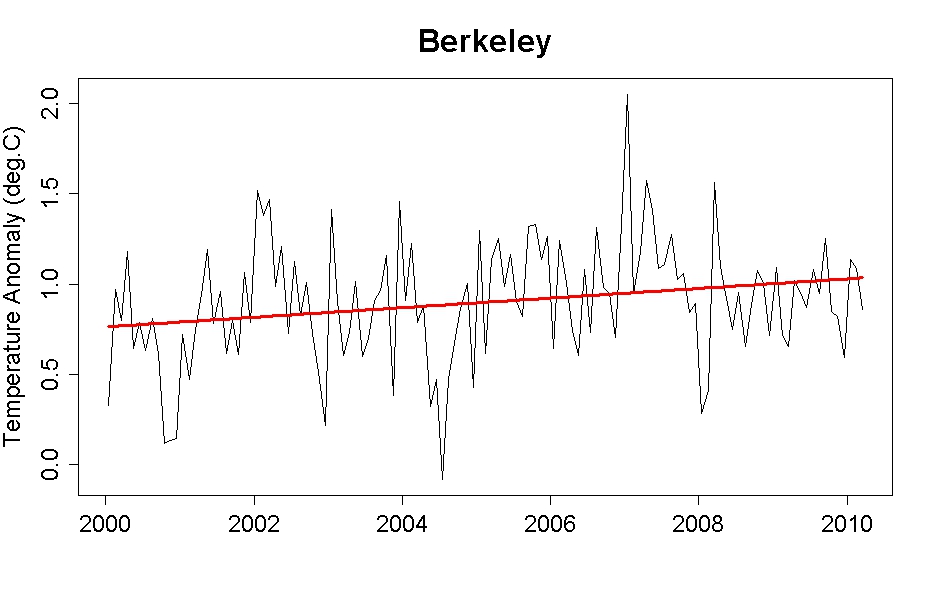
Since Judith Curry seems unwilling or unable to do the analysis, we’ll just have to do it for her. Let’s start with the data used by GWPF. Here it is with a trend line:

Please note that it starts in January 2001 and ends in May 2010, so it covers a tiny bit less than a decade! That’s a great big “red flag.”
The slope of the trend line (from ordinary least squares) is only 0.03 deg.C/decade. It’s fair to call that “flat.” But the standard error from that calculation — even if we use a white-noise model — is 0.13 deg.C/decade. So the real value could be as high as 0.29 deg.C/decade — which, curiously enough, is a tiny bit higher than the trend rate in the Berkeley data from 1975 to the present — a period for which you can only deny warming if you’re both blind and insane. And yes, it could easily be an even higher slope since we’ve used a white-noise model, which underestimates the uncertainty. Hey Judith: there’s a scientific basis for you.
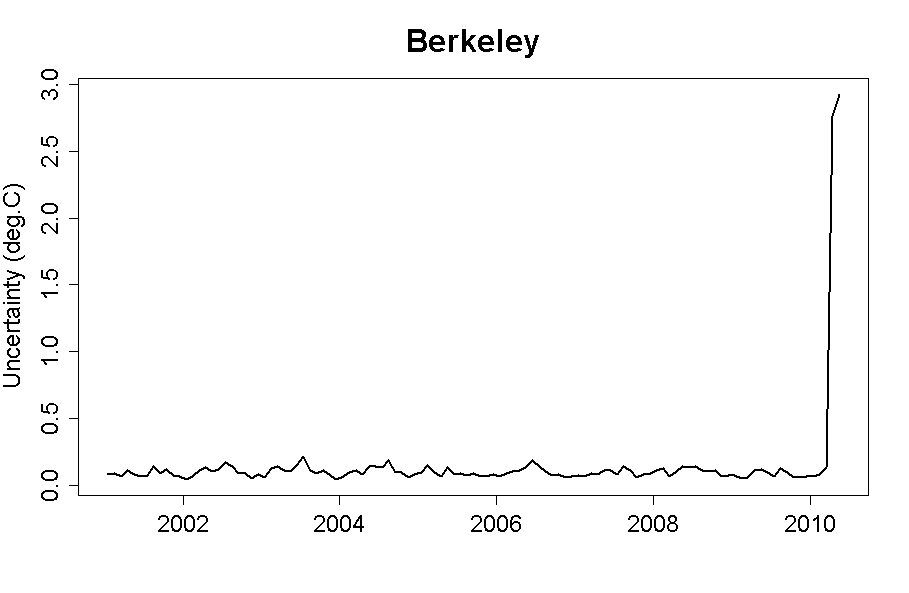
But that’s not all! The Berkeley data also include uncertainty levels for each monthly value. Let’s graph the uncertainties:

Whoa!!! What’s that huge spike at the end? It rises faster than a “hockey stick”!
The huge spike is the huge uncertainty level of the final two data points — April and May 2010. While the other data have uncertainty levels around 0.1 deg.C, those two months have uncertainty levels of 2.8 and 2.9 deg.C. Which makes them, plainly, unreliable.
And notice that one of those too-uncertain-to-be-useful data points is the deep “dip” at the end, the April 2010 value which is about 2 deg.C below the trend line. It’s called an “outlier,” in fact it’s an outlier of the first magnitude, a really big super-giant “this ain’t right” staring you in the face. And since it’s a super-giant dip it’s gonna skew the trend estimate low. The simplest correct thing to do is to omit those two data points.
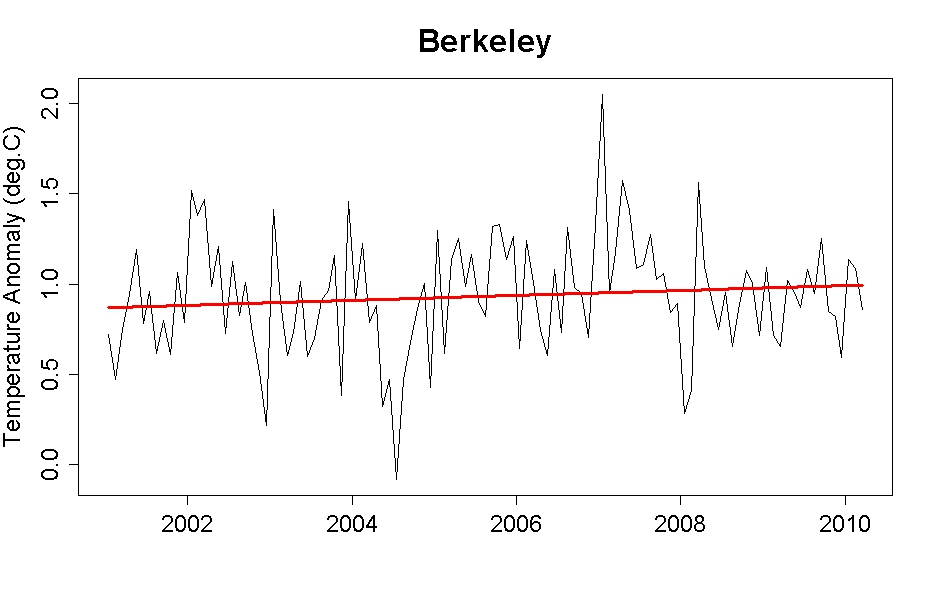
So let’s do it again, but end at March 2010 rather than include the uber-fuzzy April and May 2010 data. Here’s the trend line from 2001:

Now it’s noticeably upward. The estimated slope is 0.14 deg.C/decade — more than four times as large, just from removing two errant data points. Its standard error is 0.11 degC/decade, so the real trend rate could be as high as 0.36 deg.C/decade, quite a bit larger than the average rate since 1975. And yes, it could easily be an even higher slope since we’ve used a white-noise model, which underestimates the uncertainty. Hey Judith: there’s another scientific basis for you.
To show just how sensitive the results are to such a short time span — and how misleading it can be to make pronouncements on that basis — let’s consider a time span just one year longer, starting in 2000 rather than 2001. That gives this:

Now the trend rate is up to 0.27 deg.C/decade. That’s just about the same as the trend rate from 1975! Hey Judith: there’s another scientific basis for you.
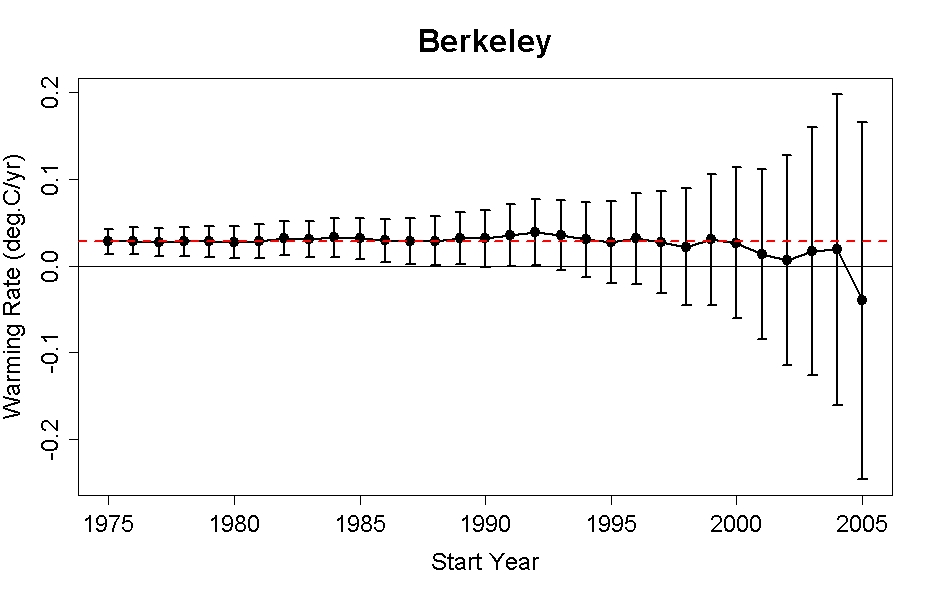
As a last bit of analysis, let’s omit the outlier data, then compute the trend for each starting year to the present, for all start years from 1975 to 2005. Let’s also estimate the confidence intervals using a more realistic error model. What would that show? This:
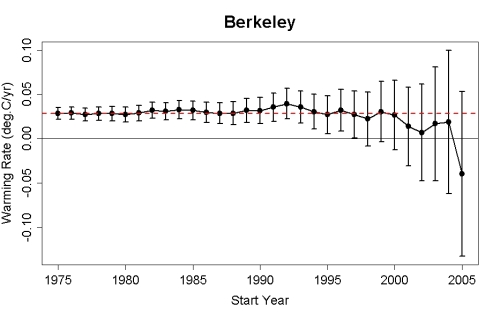
The red dashed line shows the trend rate from 1975. Note that not one single start year gives an estimate which contradicts that rate. That is evidence — damn strong evidence in fact — that the underlying trend rate has not changed since 1975. Hey Judith: there’s a REAL scientific basis for you.
Here’s the kicker: the uncertainty in those trend rates is probably higher, perhaps by a substantial amount, because that graph is based on an AR(1) model for the noise. Using an ARMA(1,1) model instead gives this:

That shows just how mistaken, how foolish, how downright boneheaded it is to say that “There is no scientific basis for saying that warming hasn’t stopped.”
Judith Curry’s statement is exactly the kind of ill-thought-out or not-at-all-thought-out rambling which is an embarrassment to her, and an embarrassment to science itself. To spew this kind of absolute nonsense is shameful. Judith Curry, you should be ashamed of yourself.
Richard Muller, the target of Curry’s ire, also managed to embarrass himself:
However, he admitted it was true that the BEST data suggested that world temperatures have not risen for about 13 years. But in his view, this might not be ‘statistically significant’, although, he added, it was equally possible that it was – a statement which left other scientists mystified.
Of course we’re mystified. Didn’t you do the analysis? Don’t you know? Honestly, what kind of insane world do we live in when we get this level of discussion about one of the most crucial issues of our time, from people who are supposed to be scientists?
In my opinion, the WORST aspect of this is that Judith Curry states unequivocally that “Our data show the pause,” which utterly ignores the extreme level of uncertainty in temperature trends over periods as short as 10 years or less, after she has so often indulged in self-righteous posturing on her own blog about the “uncertainty monster.” It looks like the “uncertainty monster” decided to turn around and bite her on the ass.
Regarding Curry’s involvement with the press release, and the submission of papers, the Daily Mail reports that “Prof. Muller failed to consult her before deciding to put them on the internet earlier this month, when the peer review process had barely started, and to issue a detailed press release at the same time.” She stated, “It would have been smart to consult me.” On her blog she says:
My continued collaboration on this project will be discussed this week with Muller and Rohde.
It seems to me that what would really be smart is to find someone else to be on the Berkeley team.
UPDATE:
Judith Curry protests that she was misrepresented by the article in the Daily Mail, and several readers have mentioned that David Rose, the author of the article, is just the man to do such a thing. It’s easy to believe that she was indeed the victim of his malfeasance.
But even after reading this post, she still hasn’t disavowed the statement “There is no scientific basis for saying that warming hasn’t stopped.” In fact she commented on her own blog saying, “There has been a lag/slowdown/whatever you want to call it in the rate of temperature increase since 1998.” Question for Curry: What’s your scientific basis for this claim?
Posted on October 30, 2011 by tamino| 39 Comments
NOTE: See the UPDATE at the end of this post.
I didn’t expect Judith Curry to embarrass herself more than she did with her fawning over Murry Salby’s folly. But she’s topped (perhaps I should say “bottomed”) herself by a huge margin.
Anthony Watts was so excited he actually suspended his blog hiatus to report the story. He quotes the GWPF that “BEST Confirms Global Temperature Standstill,” and cites a story in the Daily Mail reporting that Judith Curry (a member of the Berkeley team) has roundly criticized Richard Muller (leader of the Berkeley team), on much the same basis. He quotes Curry herself, from the article:
As for the graph disseminated to the media, she said: ‘This is “hide the decline” stuff. Our data show the pause, just as the other sets of data do. Muller is hiding the decline.
Judging by her comments, it’s a good thing for the Berkeley team that she didn’t. The Daily Mail quotes her thus:
‘There is no scientific basis for saying that warming hasn’t stopped,’ she said. ‘To say that there is detracts from the credibility of the data, which is very unfortunate.’
Now that the Daily Mail and Anthony Watts have not only let the cat out of the bag but put it on display to make a “scandal” out of it, Curry seems to want to distance herself from her criticism. On her own blog she says:
I told Rose that I was puzzled my Muller’s statements, particularly about “end of skepticism” and also “We see no evidence of global warming slowing down.”
When asked specifically about the graph that apparently uses a 10 year running mean and ends in 2006, we discussed “hide the decline,” but I honestly can’t recall if Rose or I said it first. I agree that the way the data is presented in the graph “hides the decline.” There is NO comparison of this situation to Climategate. Muller et al. have been very transparent in their methods and in making their data publicly available, which is highly commendable.
My most important statement IMO is this: ‘To say that there is detracts from the credibility of the data, which is very unfortunate.’ My main point was that this is a very good data set, the best we currently have available for land surface temperatures. To me, this should have been the big story: a new comprehensive data set, put together by a team of physicists and statisticians with private funds. Showing preliminary results is of course fine, but overselling them at this point was a mistake IMO.
Just looking at the data isn’t enough. It’s all too easy to view some graph and get the wrong impression — in fact that what groups like GWPF exploit. Here, for instance, is the graph featured by GWPF:

The impression it gives, that global warming has stopped, is wrong. It’s the kind of easy misinterpretation based on the absence of both context and analysis which is constantly exploited by fake skeptics. I expect GWPF to disdain both context and analysis. But Judith Curry is supposed to be an actual scientist. I’m skeptical.
Since Judith Curry seems unwilling or unable to do the analysis, we’ll just have to do it for her. Let’s start with the data used by GWPF. Here it is with a trend line:
Please note that it starts in January 2001 and ends in May 2010, so it covers a tiny bit less than a decade! That’s a great big “red flag.”
The slope of the trend line (from ordinary least squares) is only 0.03 deg.C/decade. It’s fair to call that “flat.” But the standard error from that calculation — even if we use a white-noise model — is 0.13 deg.C/decade. So the real value could be as high as 0.29 deg.C/decade — which, curiously enough, is a tiny bit higher than the trend rate in the Berkeley data from 1975 to the present — a period for which you can only deny warming if you’re both blind and insane. And yes, it could easily be an even higher slope since we’ve used a white-noise model, which underestimates the uncertainty. Hey Judith: there’s a scientific basis for you.
But that’s not all! The Berkeley data also include uncertainty levels for each monthly value. Let’s graph the uncertainties:
Whoa!!! What’s that huge spike at the end? It rises faster than a “hockey stick”!
The huge spike is the huge uncertainty level of the final two data points — April and May 2010. While the other data have uncertainty levels around 0.1 deg.C, those two months have uncertainty levels of 2.8 and 2.9 deg.C. Which makes them, plainly, unreliable.
And notice that one of those too-uncertain-to-be-useful data points is the deep “dip” at the end, the April 2010 value which is about 2 deg.C below the trend line. It’s called an “outlier,” in fact it’s an outlier of the first magnitude, a really big super-giant “this ain’t right” staring you in the face. And since it’s a super-giant dip it’s gonna skew the trend estimate low. The simplest correct thing to do is to omit those two data points.
So let’s do it again, but end at March 2010 rather than include the uber-fuzzy April and May 2010 data. Here’s the trend line from 2001:
Now it’s noticeably upward. The estimated slope is 0.14 deg.C/decade — more than four times as large, just from removing two errant data points. Its standard error is 0.11 degC/decade, so the real trend rate could be as high as 0.36 deg.C/decade, quite a bit larger than the average rate since 1975. And yes, it could easily be an even higher slope since we’ve used a white-noise model, which underestimates the uncertainty. Hey Judith: there’s another scientific basis for you.
To show just how sensitive the results are to such a short time span — and how misleading it can be to make pronouncements on that basis — let’s consider a time span just one year longer, starting in 2000 rather than 2001. That gives this:
Now the trend rate is up to 0.27 deg.C/decade. That’s just about the same as the trend rate from 1975! Hey Judith: there’s another scientific basis for you.
As a last bit of analysis, let’s omit the outlier data, then compute the trend for each starting year to the present, for all start years from 1975 to 2005. Let’s also estimate the confidence intervals using a more realistic error model. What would that show? This:

The red dashed line shows the trend rate from 1975. Note that not one single start year gives an estimate which contradicts that rate. That is evidence — damn strong evidence in fact — that the underlying trend rate has not changed since 1975. Hey Judith: there’s a REAL scientific basis for you.
Here’s the kicker: the uncertainty in those trend rates is probably higher, perhaps by a substantial amount, because that graph is based on an AR(1) model for the noise. Using an ARMA(1,1) model instead gives this:
That shows just how mistaken, how foolish, how downright boneheaded it is to say that “There is no scientific basis for saying that warming hasn’t stopped.”
Judith Curry’s statement is exactly the kind of ill-thought-out or not-at-all-thought-out rambling which is an embarrassment to her, and an embarrassment to science itself. To spew this kind of absolute nonsense is shameful. Judith Curry, you should be ashamed of yourself.
Richard Muller, the target of Curry’s ire, also managed to embarrass himself:
However, he admitted it was true that the BEST data suggested that world temperatures have not risen for about 13 years. But in his view, this might not be ‘statistically significant’, although, he added, it was equally possible that it was – a statement which left other scientists mystified.
In my opinion, the WORST aspect of this is that Judith Curry states unequivocally that “Our data show the pause,” which utterly ignores the extreme level of uncertainty in temperature trends over periods as short as 10 years or less, after she has so often indulged in self-righteous posturing on her own blog about the “uncertainty monster.” It looks like the “uncertainty monster” decided to turn around and bite her on the ass.
Regarding Curry’s involvement with the press release, and the submission of papers, the Daily Mail reports that “Prof. Muller failed to consult her before deciding to put them on the internet earlier this month, when the peer review process had barely started, and to issue a detailed press release at the same time.” She stated, “It would have been smart to consult me.” On her blog she says:
My continued collaboration on this project will be discussed this week with Muller and Rohde.
UPDATE:
Judith Curry protests that she was misrepresented by the article in the Daily Mail, and several readers have mentioned that David Rose, the author of the article, is just the man to do such a thing. It’s easy to believe that she was indeed the victim of his malfeasance.
But even after reading this post, she still hasn’t disavowed the statement “There is no scientific basis for saying that warming hasn’t stopped.” In fact she commented on her own blog saying, “There has been a lag/slowdown/whatever you want to call it in the rate of temperature increase since 1998.” Question for Curry: What’s your scientific basis for this claim?
I see drought in my future.
Ocean Temperatures in the 1930's Were Unstable
Scientists at NASA's Goddard Space Flight Center recently used a computer model and satellite data to examine climate over the past century. In the study, cooler than normal tropical Pacific Ocean temperatures and warmer than normal tropical Atlantic Ocean temperatures created ideal drought conditions due to the unstable sea surface temperatures. The result was dry air and high temperatures in the Midwest from about 1931 to 1939.
1934 United States Temperature Extreme Rankings by State
I agree, places like Texas, Arizona (South West) are drying up just like in the 1930's. You just have to look at the huge dust storms they had this year.
The article begins with an outright lie so I read no further. Professor Jones made no such concession and no other scientist has either. The American Thinker is one more American Jokester.Another sky-is-falling analysis.
Articles: Prediction: Global Warming Will Cause Everything
It was just an expression of a little journalistic license, nothing to get worried about.
But on that note, what were your thoughts about Jones basically having to concede his previous, peer reviewed models/statements?
But on that note, what were your thoughts about Jones basically having to concede his previous, peer reviewed models/statements?
Jones never did cincede that. What Jones did say was that the warming for a ten year period was not statistically significant. That does not mean that it was ot warming. Looking at the period a few years longer he said it was significant.It was just an expression of a little journalistic license, nothing to get worried about.
But on that note, what were your thoughts about Jones basically having to concede his previous, peer reviewed models/statements?
That shorter period warmed almost as much as in the other decades in the past four but it was a little less because of extended La Ninas. It was, though, the warmest in the record.
The misrepresentation of his answer to a question is just the usual for certain media.
Another sky-is-falling analysis.
Articles: Prediction: Global Warming Will Cause Everything
"Okay, given that many in the climate change fraternity -- including, famously, Phil Jones of East Anglia University -- have been forced to concede that global warming has been on "pause" since 1995, how exactly is it "speeding the spread" of disease-carrying ticks?"
See, part of the problem with the so-called skeptics is that most aren't that savvy about the science or the statistics. What Phil Jones said was that there had not been any statistically significant warming in the past 15 years. That doesn't mean the planet didn't actually get warmer. It simply means that the amount the planet got warmer by isn't large enough to distinguish from a hypothesis that there was no warming. The finer details on that point are that the variability is large. So you need large warming before the trend rises above the noise in the system. Also, that claim only holds for the surface temperature record. Other indices of heat, such as global ocean heat content, are highly significant over the last 15 years. Anyways.
So on the one hand, the temperature trend over 15 years was non-significant at an Alpha of 0.05-the standard threshold for statistical hypothesis tests-at the time Jones made those comments. That has absolutely zero meaning biologically. The temperature rise can be enough to cause a significant increase or decrease in some biological parameter, without the trend itself being statistically significant. Biological systems are often characterized best by thresholds. Below a certain temperature, a disease won't cause infection in aquatic organisms. Below a certain concentration, a toxin won't cause an organism any ill thrift. And so on.
I wouldn't expect someone with a philosophy degree to be well versed in the difference between statistical significance, and biological significance. Much less the corollaries that important distinction carries with it...
Anything better than that Walt?
No, you're way to smart for us, at least that's what your posts imply. It is fairly cool here, though. Must be climate change. A good thing I find your posts amusing otherwise I'd have to put you on ignore; I can't stand boring.See, part of the problem with the so-called skeptics is that most aren't that savvy about the science or the statistics. What Phil Jones said was that there had not been any statistically significant warming in the past 15 years. That doesn't mean the planet didn't actually get warmer. It simply means that the amount the planet got warmer by isn't large enough to distinguish from a hypothesis that there was no warming. The finer details on that point are that the variability is large. So you need large warming before the trend rises above the noise in the system. Also, that claim only holds for the surface temperature record. Other indices of heat, such as global ocean heat content, are highly significant over the last 15 years. Anyways.
So on the one hand, the temperature trend over 15 years was non-significant at an Alpha of 0.05-the standard threshold for statistical hypothesis tests-at the time Jones made those comments. That has absolutely zero meaning biologically. The temperature rise can be enough to cause a significant increase or decrease in some biological parameter, without the trend itself being statistically significant. Biological systems are often characterized best by thresholds. Below a certain temperature, a disease won't cause infection in aquatic organisms. Below a certain concentration, a toxin won't cause an organism any ill thrift. And so on.
I wouldn't expect someone with a philosophy degree to be well versed in the difference between statistical significance, and biological significance. Much less the corollaries that important distinction carries with it...
Anything better than that Walt?[/FONT]
No, you're way to smart for us, at least that's what your posts imply.
:roll: Ahh, so pointing out the flaws in basic understanding of the press articles you link to implies that I'm too smart for this place?
Sheesh, fragile ego. Sorry to burst your bubble Walt.
You're so hurtful; where's my drink?:roll: Ahh, so pointing out the flaws in basic understanding of the press articles you link to implies that I'm too smart for this place?
Sheesh, fragile ego. Sorry to burst your bubble Walt.